Results viewing tab
The Results view displays the results of the inspection and allows the user to identify regions with serial deviations.
-
To see the actual results, click Update in the upper part of the screen.
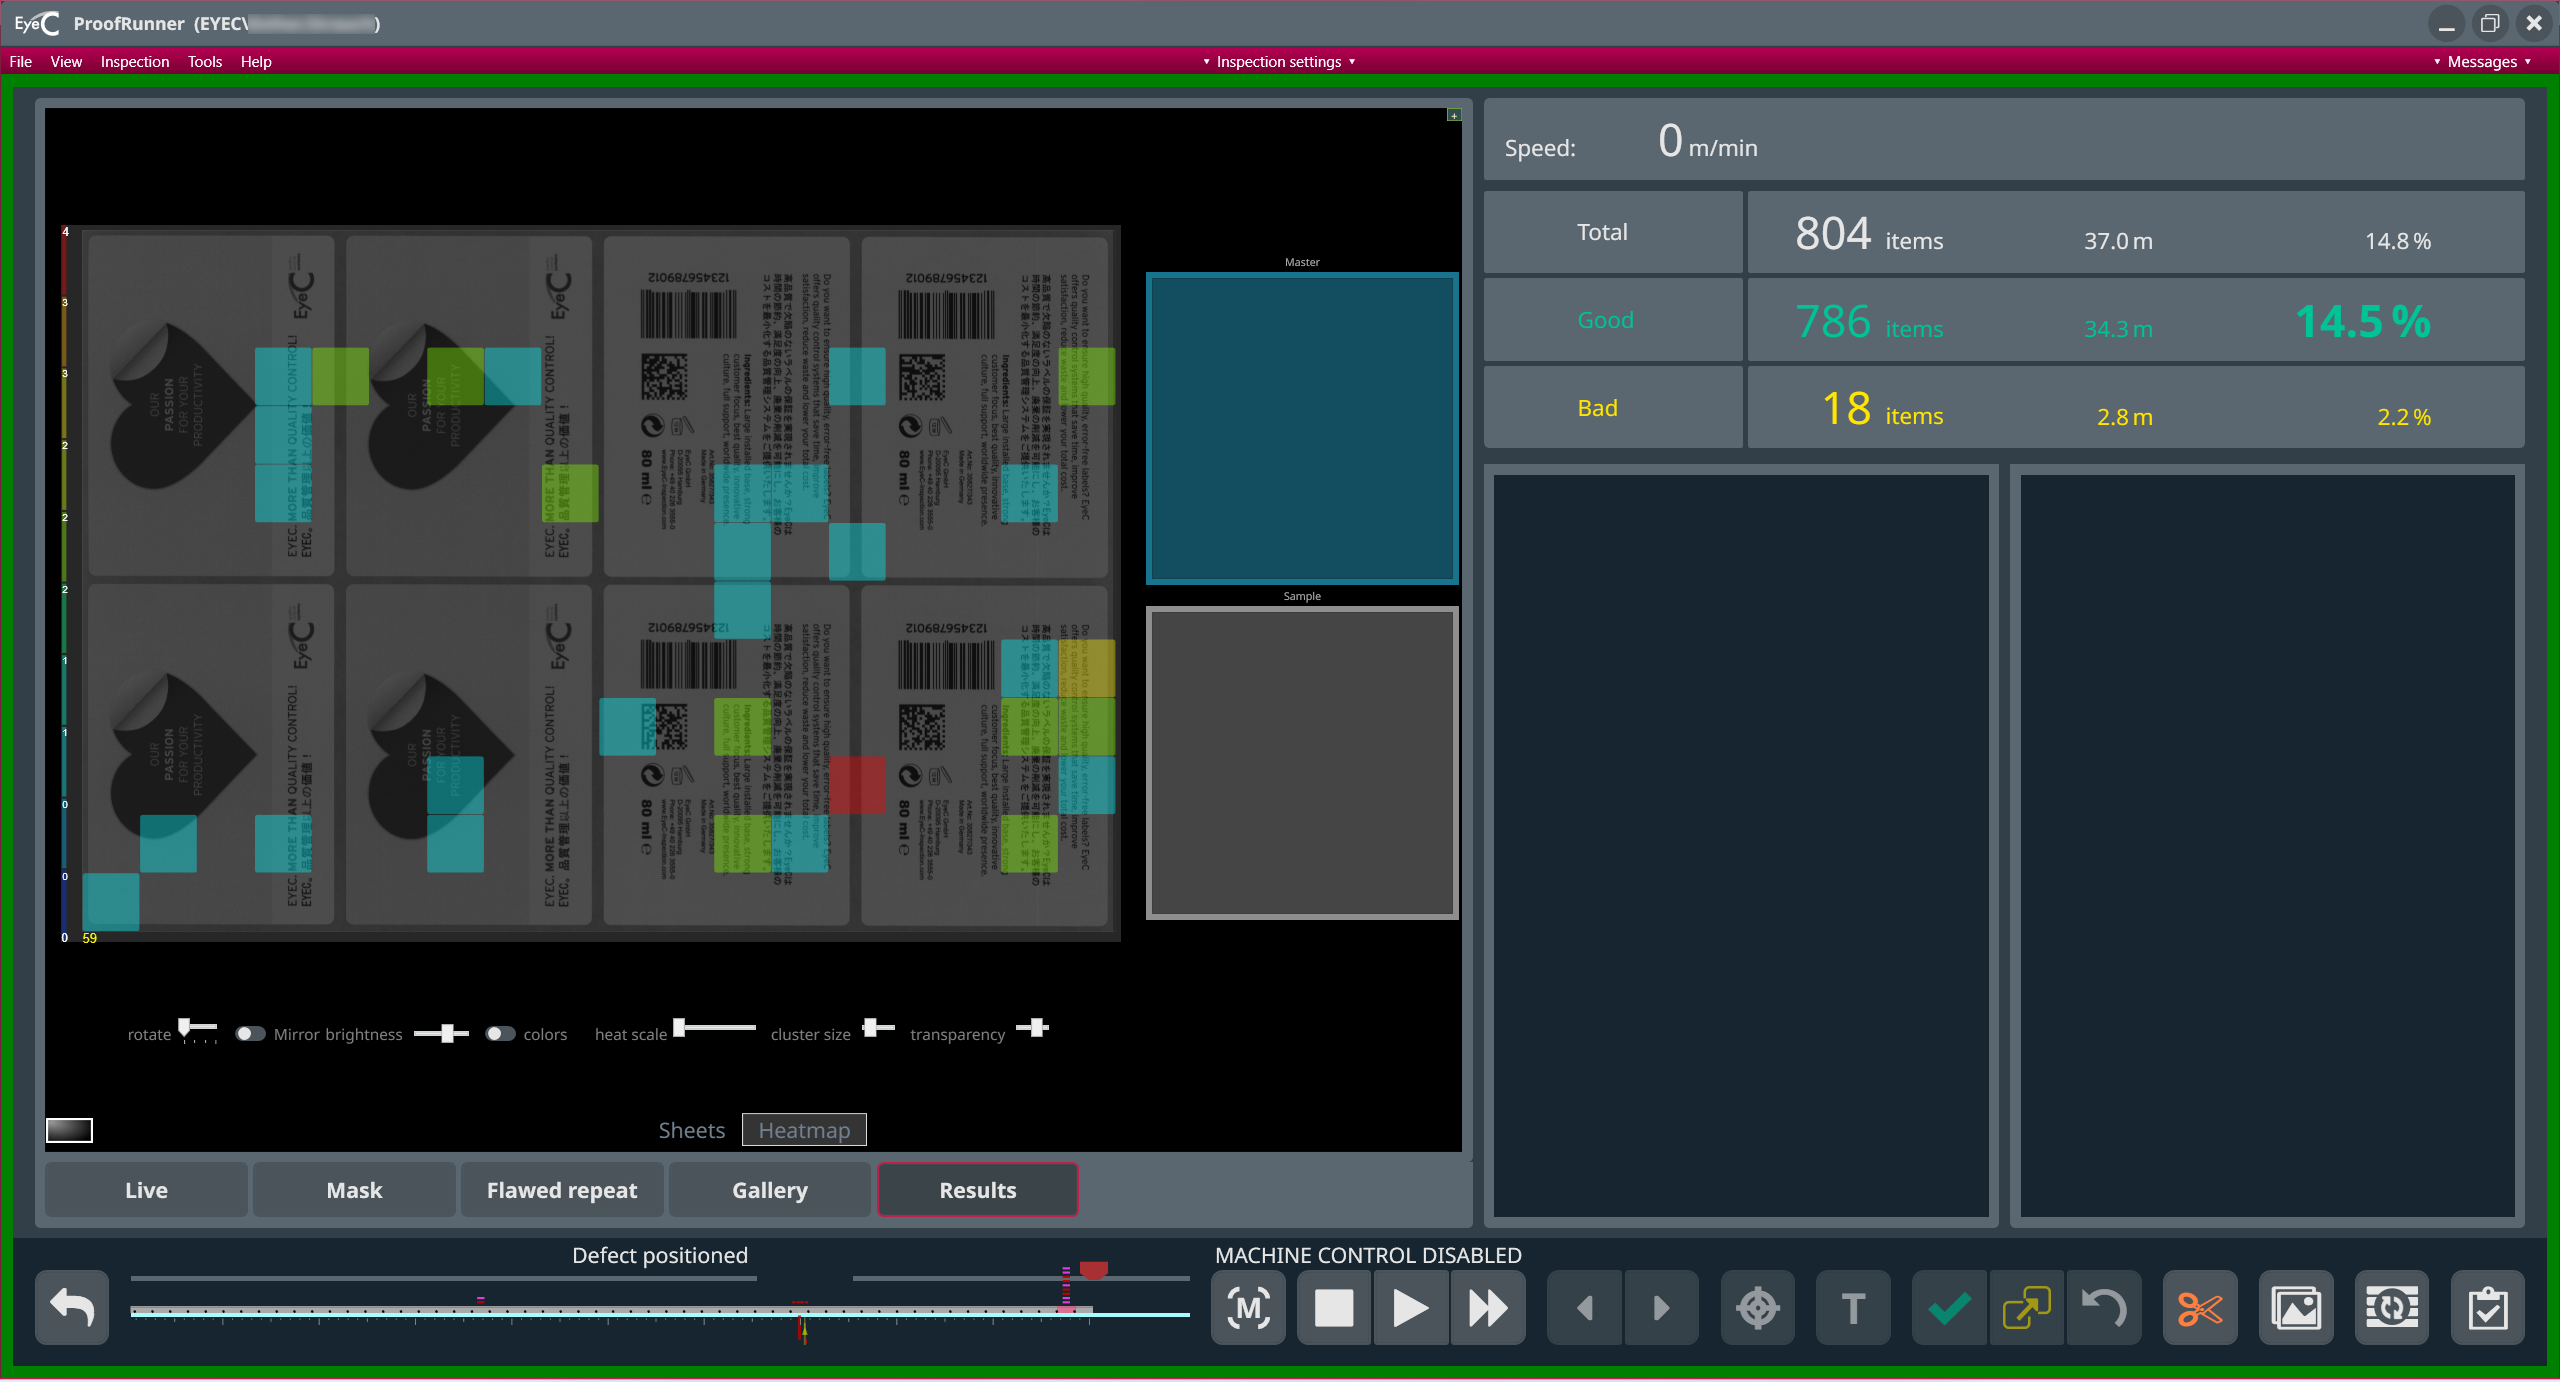
The previous figure shows the Results tab. On the left side of the screen you see an example of how the distribution of deviations can be displayed. The visualizations of the deviation distributions of all inspected repeats are laid on top of each other and summarized. Big red squares mark regions with the highest appearance of deviations, small blue squares mark regions with a low appearance of deviations. How the deviation distribution is displayed can be configured by using the tools in the grey backgrounded square in the upper part of the screen.
- To use the size of the marking squares, select the checkbox size coded.
- To use the color of the marking squares to display the deviation distribution, select the checkbox color coded.
-
On the upper left-hand side of the screen you can switch between different display options of the inspection results. Heatmap is the default view and shows a cumulative distribution of deviations on the repeat. Regions with many deviations are highlighted either by color or by the size of the marking square depending on your configuration.