
Statistics
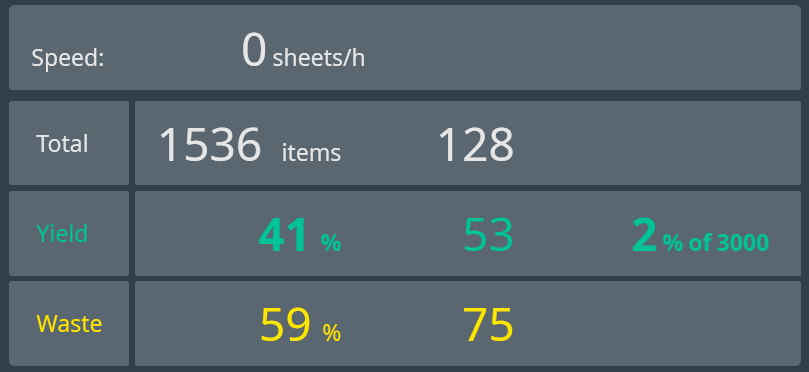
The section on the top right of the screen displays some statistical values of the actual inspection.
The biggest number on the right implies the percentage of inspected sheets in proportion to the length of the alley or the total number of all sheets to be inspected.
It is constantly updated as inspection progresses.
| Statistical parameter | Description |
|---|---|
| Speed | Shows the speed of the print process in sheets/hour (if configured). |
| Queue | A reference value for the extent to which the inspection process is temporally related to the printing process. A high value means that the printing speed is too fast or that the inspection parameters are not optimally adjusted to the printing speed. That is, that there are too many sheets in the queue. If a limit value is exceeded, the Decrease Speed display appears in the lower part of the screen. Then find the cause of the error as soon as possible and fix it. Example: In case of many pseudo-defects mask them in the Mask view. |
| Total | Shows count of all currently printed sheets. |
| Yield | Shows count of currently printed good sheets. |
| Waste | Shows count of currently printed bad sheets. |
| %-Value | Shows the percentage of printed sheets in the entire order. |
The statistics for a printing machine differentiate between usable sheets (green) and non-usable sheets (orange). In the Statistics table, a scale displays how many non-graded sheets have been captured by the EyeC ProofRunner software.
| NOTICE | |
|---|---|