The Heatmap view
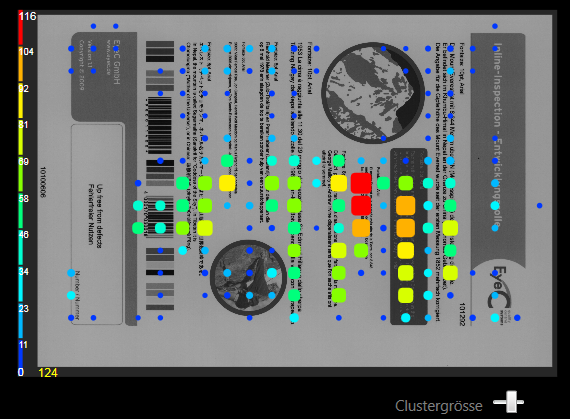
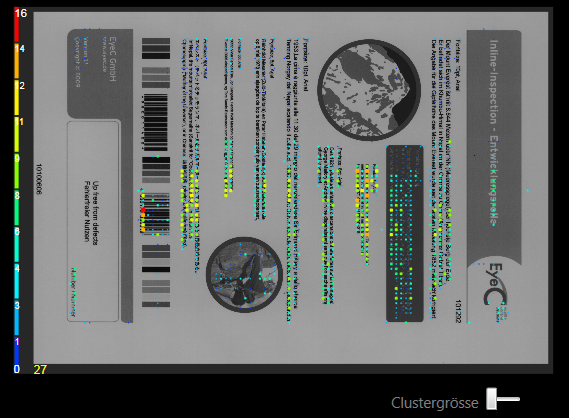
The Heatmap view is used to visualize the distribution of suspicious areas across the entire print job or a section of the print job.
-
To activate the Heatmap view, click the Heatmap button in the bottom half of the display screen.
→ The display screen then changes to the Heatmap view.

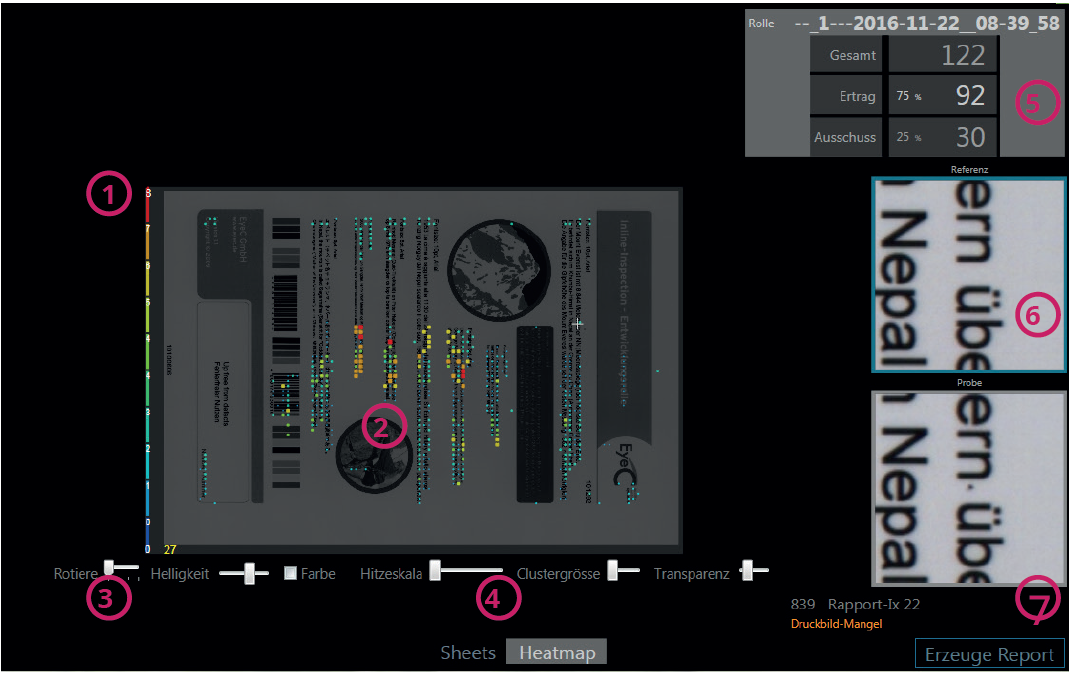
| Number | Name | Description |
|---|---|---|
| 1 | Heatmap scale | Shows the number of errors that correspond to which color value. The scale can be adjusted with the Heatscale under (3). |
| 2 | Heatmap view | Shows the allocation of errors within a print job. The frequency of the error is color-coded and can be read on the scale under (1). Red areas represent areas where errors occur particularly frequently, blue areas represent those with only a few errors. The representation of the heatmap can be adjusted with the controls under (3). |
| 3 | View settings | Controls for changing the Heatmap view:
|
| 4 | Switch sheets / Heatmap |
Switches between Sheet view and Heatmap view. Click the desired view. |
| 5 | Statistics | Shows statistical data about the print job:
|
| 6 | Detail view |
Displays the enlarged view of the suspicious areas: above is the corresponding area on the template, below on the production sample. Move the mouse over 1 of the cluster points to see the error in the detail view. |
| 7 | Create report |
Creates a report. |