
Opening an inspection file
-
Click the Launch button, which opens the file in a new window.
-
Click the file name, which opens the file in the current window.
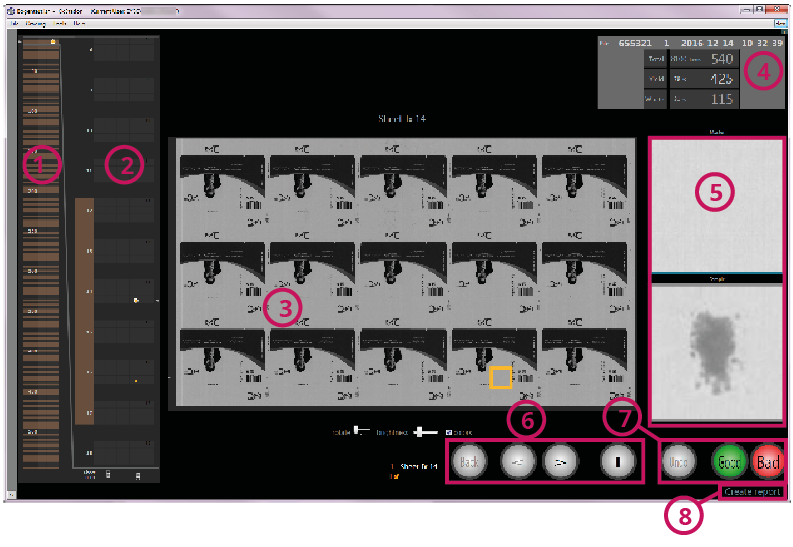
| Nr. | Name | Description |
|---|---|---|
| 1 | Complete overview |
Shows an overview of the entire batch or order. Colored areas mark places with errors. |
| 2 | Extract |
Sliding section of the overview. Shows the sheets in more detail. Areas with errors and errors on individual ups are color-marked. |
| 3 | Single sheet |
View of a selected single sheet. Suspicious areas are marked on the up with colored areas; in this figure with the orange-colored rectangle. |
| 4 | Statistics |
Shows statistical data about the print job:
|
| 5 | Detailed view |
Shows the enlarged view of the suspicious areas: above is the corresponding area on the template, below on the production sample. |
| 6 | Navigation buttons, Toggle buttons |
Enable you to navigate through the suspicious areas and Toggle views.
|
| 7 | Evaluation buttons |
Enable you to evaluate the suspicious areas:
|
| 8 | Create report |
Creates a report. |
There are 2 views of the print job:
-
Sheet view: Displays the printed sheet. You can scroll through the printed sheet in order to see and evaluate the individual errors.
-
Heatmap view: Displays the allocation of errors throughout the entire printed batch with color-coded markings. This view offers an overview so that you can easily identify slightly problematic areas or areas difficult to print. More information on the Heatmap view can be found in The Heatmap view.